Is crime increasing in New York or are people’s perceptions being affected by high-profile shocking violence in the media?

One of the hottest topics for the New York Gubernatorial debates was if crime is increasing or a weaponized talking point designed to stoke fear before an election. Prior to the debate, the news aired stories of unprovoked attacks and “hate crimes”. Some examples included victims being pushed onto the subway tracks; and, in a second subway story, a woman was viciously beaten and permanently lost vision in one of her eyes. Three other high-profile hate crimes were against Asian citizens taking photos, another simply walking down the street, and different Jewish men being beaten with fire extinguishers by a group of assailants. In each of these cases, the victims did not know the assailants, the attacks were unprovoked, and there were no obvious other motives such as robbery, road rage, or romantic conflict.

In the Gubernatorial debate, Lee Zeldin claimed he would solve the problem by declaring a crime emergency and suspending cashless bail. Governor Hochul responded with “I don’t know why that is so important to you”. She countered by claiming criminals are punished and cited a 14% decreasing crime (18% in Long Island) during her term.
So who is correct? Think tanks and political pundits have polarized views ranging from hate crimes being on the rise, to blaming mentally ill people to NYC being really safe with some moderate viewpoints splitting the difference. The most extreme rhetoric comes from National Public Radio (NPR) saying stories about crime are rife with misinformation and racism.
So can Data Science and Data Visualization be used to help us sort out any of these claims and answer the question, “is crime increasing in New York State”? If so, what can we learn and how can we share that knowledge with others?
Under the FBI’s National Uniform Crime Reporting (URC) Program, seven crimes (classified as Index Offenses) are used to track overall crime volume. These include violent crimes such as murder, negligent manslaughter, forcible rape, robbery, and aggravated assault and property crimes such as burglary, larceny, and motor vehicle theft. This data going back to 1990 is collected by the Division of Criminal Justice Services and is updated annually and stored on the New York State data portal. Utilizing Python, a skilled Data Scientist can analyze the data and create compelling charts and projects to share with public officials, influencers, and the public at large.
Let’s begin with the first part of the question and see “Is crime increasing in New York?” by looking at the state as a whole.
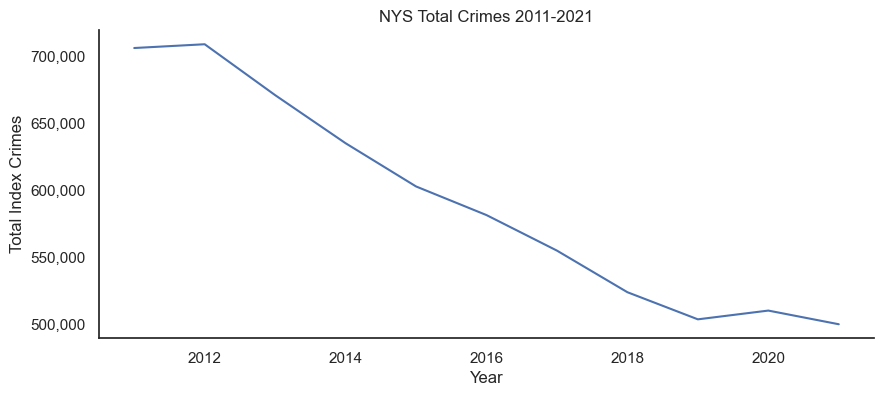
Clearly, total crimes are decreasing, but what about violent crimes and Governor Hochul’s claim about violent crimes?
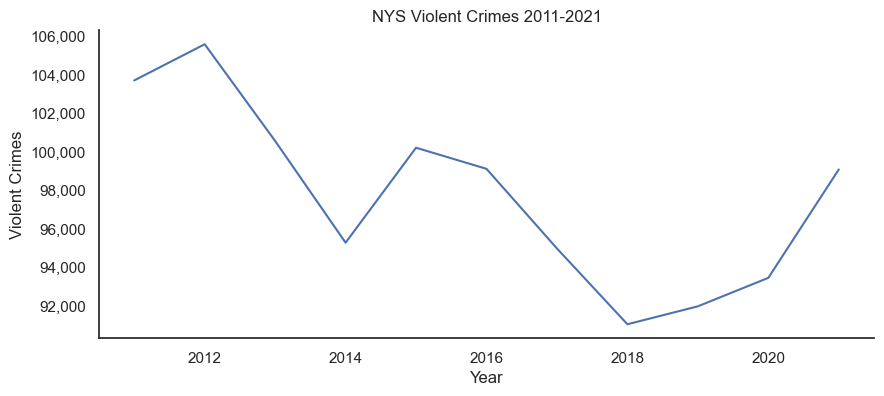
A simple line chart easily conveys that index crimes from 2011 to 2021 have been decreasing; however, there is a noticeable increase occurring for three simultaneous years in 2019, 2020, and 2021 in violent crimes.
Year-over-year growth for three consecutive years is definitely strong evidence for a relative increase in violent crimes and not simply seasonality or a spike due to an incident. So given the data and two relatively simple visualizations, we can see that both people have some valid opinions about crimes in New York; however, we have to dig deeper and look at people’s perceptions of crime to answer the question: “Is crime increasing in New York or are people’s perceptions being affected by high profile shocking violence in the media”?
Perception of crime is not as simple as looking at total crimes versus violent crimes. Factors including relative time and the diversity of people in a large area also affect how people perceive crime. In fact, the USGS estimates New York to have 47,126 square miles of land, and in that space are mountainous areas, farmlands, small towns, suburbs, and larger metropolitan areas including New York City, Buffalo, Rochester, Syracuse, and Albany. In each of those areas, people live out their day-to-day lives largely oblivious of crime in the areas that are not interfacing. With this in mind, the Z-score of the crime data (standardized) for each year can be separated into counties. Total index crime was analyzed without separating violent from non-violent as people colloquially do not make this distinction when asked “is crime increasing”. Even with standardized data, a graph with a line for each of the sixty-two counties would be horribly confusing, and looking at a dashboard with sixty-two separate line charts would be overwhelming and scare off an influencer, politician, or average citizen. To solve this, we need a different visualization.
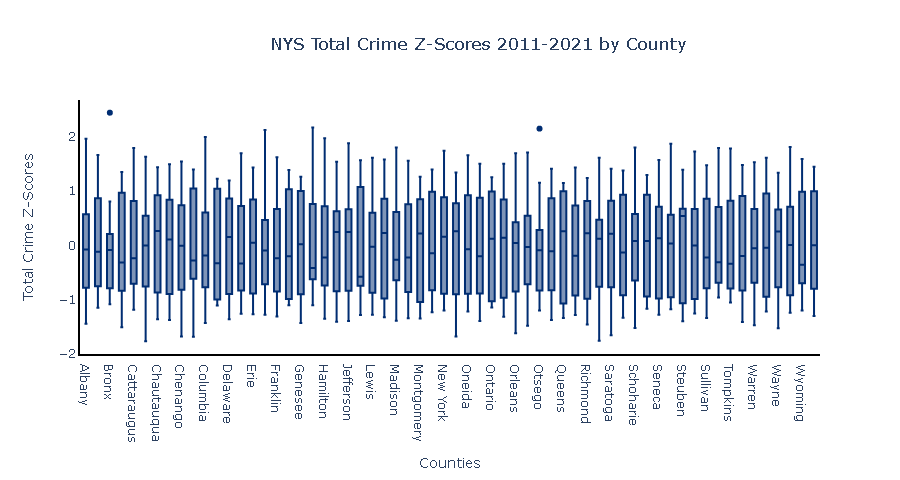
The box plots above represent the standardized total index crime counts in each county over the ten-year period. Each of the boxes is relatively symmetric in shape with the inner quartiles with only two ‘dots’. These two dots indicate a high number of index crimes relative to that county over ten years in the Bronx and Otsego counties so a one-year spike in both counties where the spike is more than two standard deviations larger than the mean of the ten-year span. Once the data is re-arranged by year, a fascinating pattern emerges.
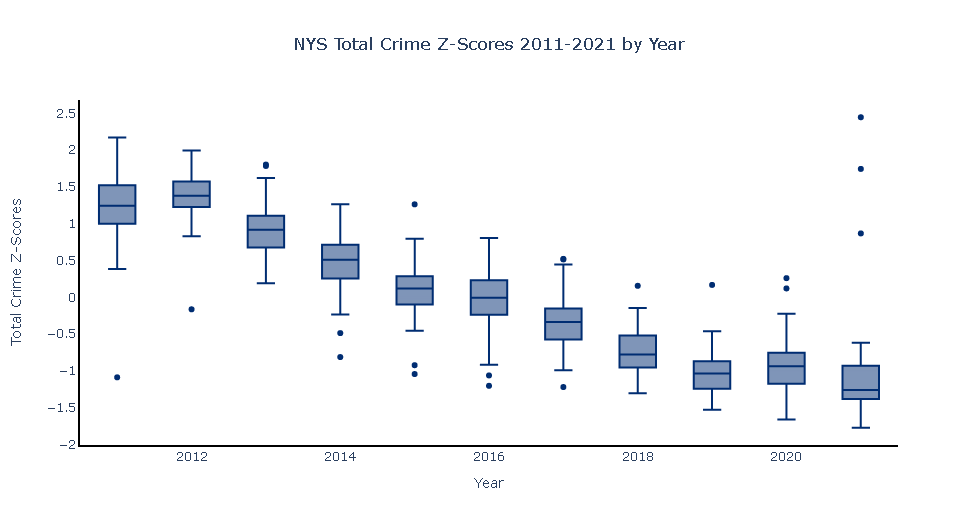
The medians of the standardized scores (center lines in the boxes) keep decreasing year over year, indicating that standardized values representing index crimes are consistently decreasing in all of the counties year over year. This means that total index crimes are decreasing over the majority of the sixty-two counties year over year with a few full-year increases in relatively few counties.
As a statistician, this kind of plot is easy for me to understand and creates visual impact; however, the average citizen or politician might get lost in the complexity of box plots and Z-scores, and the raw numbers would overly bias large population centers. To this end, we need a third type of visualization to effectively present the crime data to people.
A choropleth is a great way to visualize data on a map, and by using counties, we can show the standardized total index crimes in each county in each year, and with a slider, we can show the change year over year and although this visualization is the strongest one so far in terms of telling a complex data-story simply, the z-scores going from -3 to 3 would be very confusing to the average person.
Performing a simple one-to-one transformation and mapping the values onto a 0-100 scale, we can create the graph. The visualization showing the counties highlights the hot spot growing in the cluster of counties that people identify as the New York City Metro area.
So to answer our original question, “Is crime increasing in New York, or are people’s perceptions being affected by high-profile violence in the media?” – Yes and No*. Although total crime is still down relative to ten years ago, violent crime has been increasing over the past three years and crime overall is increasing relatively in the New York City metro area where 64% of New Yorkers live. This increase is part of a multi-year trend and is not due to a single incident or season.
The Python Code (Jupyter notebook) is available on the Rochester Analytics public GitHub.