Using a post-service survey is one of the more common ways a company receives feedback from clients and customers. Surveys take a lot of time to design and properly analyze. This blog post will show the difference between a basic analysis and an advanced analysis of a single survey question. Survey design is a separate topic that is worthy of a whole academic course. The following example is a hypothetical survey sent to doctors to determine their satisfaction with a for-doctors-only service.
The ‘Question’
Please rate the following statement on a scale from 1-5 (where 1 is strongly disagree and 5 is strongly agree): The customer support team was helpful.
Basic Analysis
Basic analysis typically consists of a Pivot Table/Chart and a brief textual writeup Illustrated in the chart/table without providing much insight. For example:
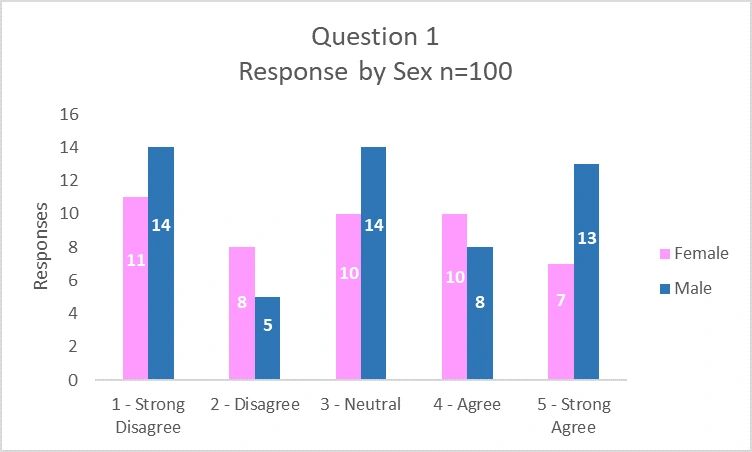
Figure 1.
Figure one above shows a simple count of responses and uses a pivot table and chart to show a count of each response by sex. A basic write-up might re-iterate and provide insight such as:
38% of those surveyed had unfavorable responses (Disagree and Strongly Disagree), 38% of those surveyed had favorable responses (Agree and Strongly Agree), and 24% had neutral responses. Males and females had similar favorable and unfavorable views of customer service.
The analysis above is computationally accurate and does provide some insights; however, it doesn’t account for the fact that males and females of different ages responded in different proportions than exist in the population. If the company has analyzed its call center data it might see something very different than the responses from the survey.
Advanced Analysis
Due to differences in age and sex of respondents relative to the population of doctors, I created a multivariate weighting system to project potential population responses.
Using the same data and adjusting for age and sex analysis the following would be provided:
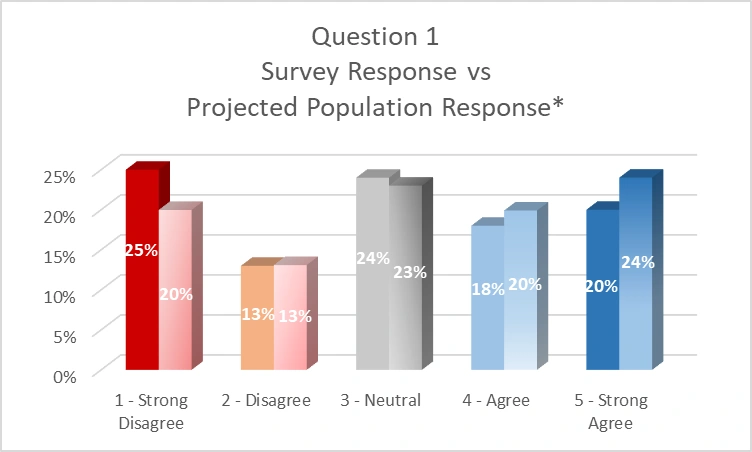
Figure 2
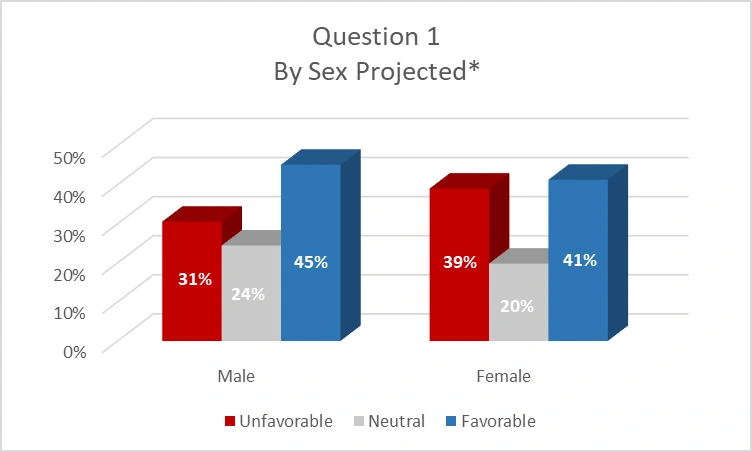
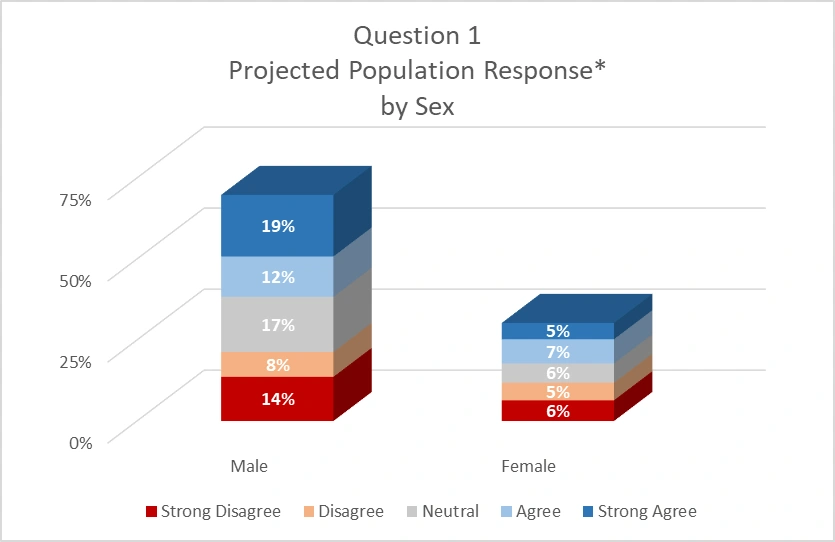
In a side-by-side bar-chart (figure 2), we can see there are some small response differences after the survey data (left bars) is adjusted to reflect the makeup of the population (right bars). Drilling down, we can see in figure 3 that male and female doctors have similar favorable and unfavorable responses rates; however, the call center may encounter more favorable and unfavorable responses from male doctors due to the differences in population and not due to the perceptual differences of customer service by male and female doctors (figure 4).
Conclusions
Advanced analytics such as multivariate weighting illustrate nuance in the data and highlight potential discrepancies between what is observed “on the ground” and the feedback received in the survey. Although an internal analysis might show male doctors are twice as likely to have unfavorable responses, this difference is shown in the survey to be an artifact of population differences and not a difference in how male doctors perceive customer service compared to how female doctors perceive customer service. This type of advanced analytics may have saved the company from a lawsuit or a costly operations change. The value of a good business analyst cannot be understated.