
New York’s Income Tax
Does “Tax and Spend” Work?

Introduction
As the 2026 gubernatorial race in New York continues on, one of the biggest issues New Yorkers raise at town hall meetings is the “affordability crisis”. Governor Hochul (D-NY) claims that increasing funding of government programs through increased taxation builds prosperity for all New Yorkers; but, is this true?
Literature Review
In The General Theory of Employment, Interest, and Money (1936) John Maynard Keynes viewed “tax and spend” style policies as a stabilization tool and argued that deficit spending during economic down turns multiplies demand and corrects lowered private investment, restoring employment. In The Communist Manifesto (1848), Karl Marx and Friedrich Engels endorsed progressive taxation and expansive spending beyond short-run demand management to redistribute wealth and create collective ownership. In contrast, Milton Friedman’s works There’s No Such Thing as a Free Lunch (1975) and Capitalism and Freedom (1962) rejected Keynes’ claim and argued that tax-financed spending crowds out private investment and discourages work and saving. Similarly, in the book The Road to Surfdom (1944), Friedrich Hayek and Milton Friedman argue that taxation destroys the ability for people to make Economic choices.
Data And Methodology
New York State has been using Progressive Taxation for decades and the state has been consistently following economically progressive policies in utilizing increased taxes to fund programs and a progressive taxation structure (taxing wealthier individuals at higher rates). To assess if progressive economics and taxation policies work, data from government sources was downloaded and analyzed to see how New York compares to other states and the United States as a whole.
- An analysis of the population counts from the United States Census (1991-2025) to look at relative population growth across the United States and New York to see if people were coming to or leaving New York due to increased social programs and public investment.
- A comparison of the GINI coefficient which measures household income inequality across several states and the country (2011-2024) to see if New York’s GINI coefficient compares to other states and the country as a whole.
- Comparing New York Personal Income Tax collection per capita versus population (1991-2025) to see if there is relationship between the tax burden and the growth of New York State’s population.
Results
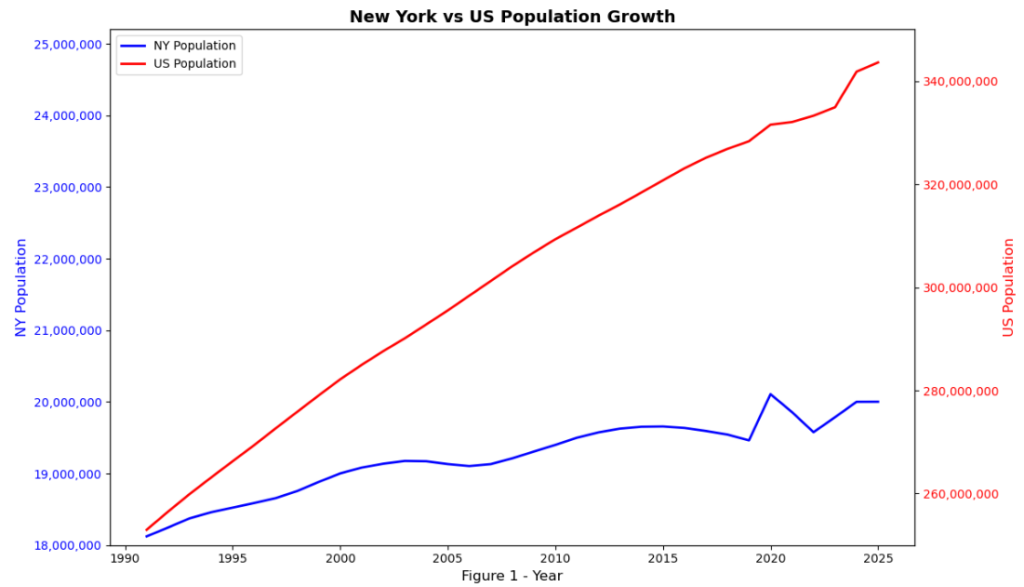
In Figure 1, New York’s population (blue line) has increased slowly since 1991 having only grown 10% (18.1M to 20M) compared to 36% growth nationally (red line). This lower population growth rate compared to the total United States population led to a loss of 5 electoral college votes since 1992 and 13 electoral college votes since the 1970s and indicates a consistent 55 year long trend of relative decline.
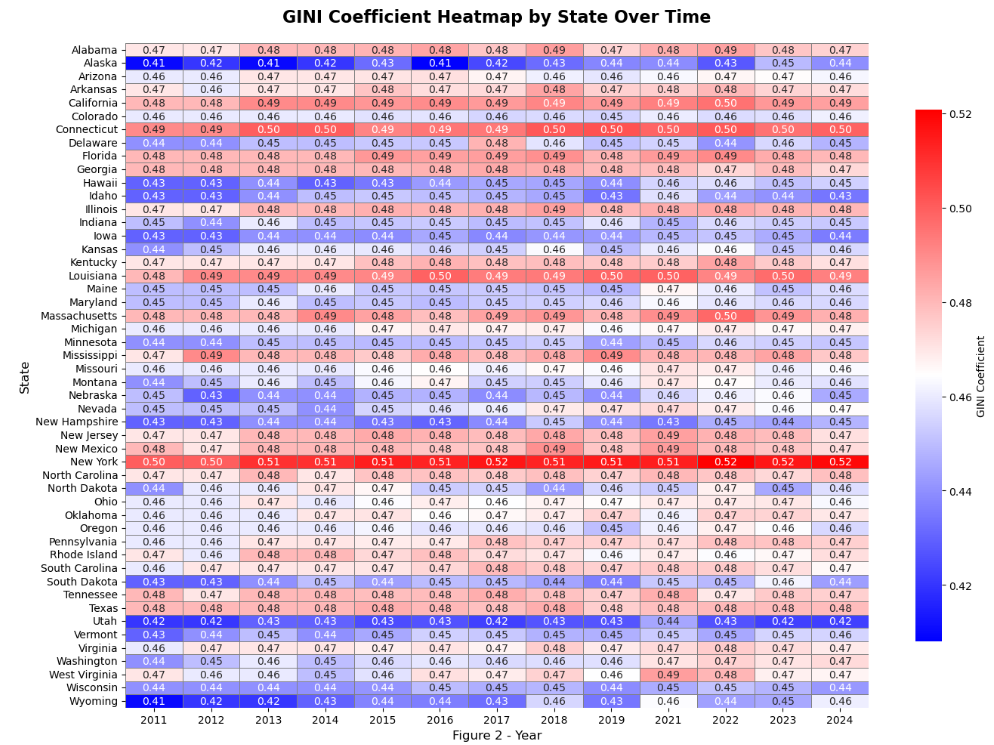
As of 2024, New York has the highest inequality measurements (GINI coefficient) of all states (Figure 2). In this heatmap, states with red color have more income inequality than average and blue have less inequality than average. New York has consistently had high income inequality across the span of 2011-2024 and the trend is to a worsening state of inequality (darker shade of red).
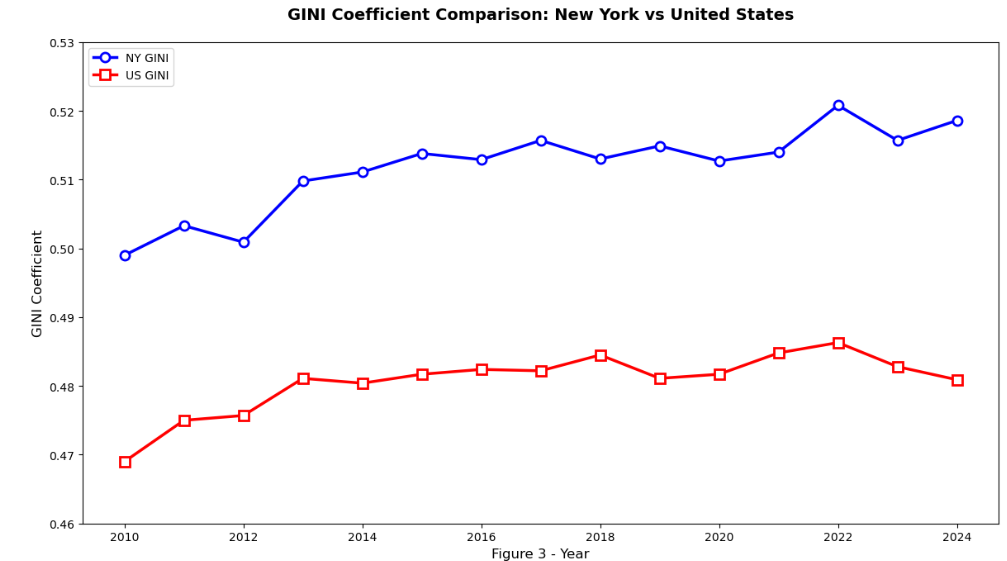
Since 2021, the measurement of household income inequality (GINI coefficient) has been increasing in New York (blue line) and decreasing in the US (red line) more broadly (Figure 3). This trend indicates that policies in New York are exacerbating inequality and are not part of a larger national trend.
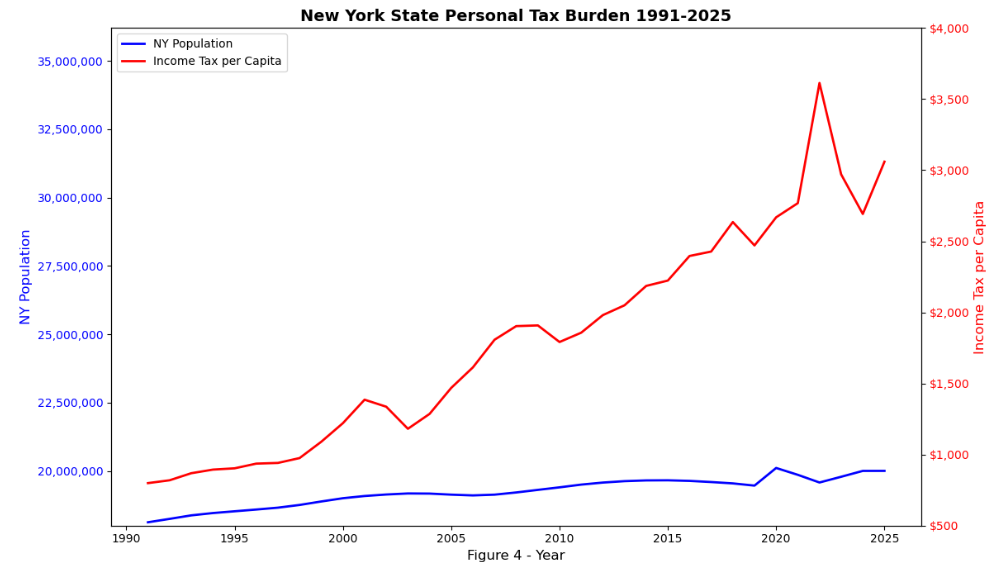
Personal income tax collected (red line) has grown from $14.4 billion to $61 billion (an increase of 323%) and the tax burden per capita has increased from $799 to $3060, an increase of 283% (Figure 4). Using the inflation calculator, $800 in 1991 would be worth $1891 today and $14.4 billion collected in 1991 would be worth $34.04 billion in today’s dollars. The increase in tax burden to $3060 per capita far exceeds inflation. The large spike in personal income tax collected around 2021 correlates to the current upward trend in inequality occurring in New York (Figure 3).
Conclusions
New York has the highest inequality metrics of all states (Figure 2) and inequality in New York is on an increasing trend since 2010 while inequality across the United States is on a decreasing trend since 2022 (Figure 3). This spike in inequality beginning in 2021 is most likely driven by an increase in state spending and taxation to fund COVID-19 relief efforts and may correlate to longer and more aggressive COVID-19 lockdowns (Figure 4). The broader increase in inequality in New York may be attributed to New York State tax and spend polices more broadly as only New York and Connecticut have concerning increases in inequality (Figure 2). Overall, tax and spend policies in New York have not been beneficial to population growth or to lowering income inequality.
About the Author

Samuel Sanfratello is the Owner and Sr. Data Scientist for Rochester Analytics. He has a Master of Science in Applied Business Analytics from American Public University. Samuel is President Emeritus of the Mu Zeta Chapter of Delta Mu Delta International Honor Society in Business at APUS, member of Golden Key International Honour Society, and member of The National Society of Leadership and Success.
GitHub: https://github.com/SamSanfratello/2026_02_NY_Tax_Policy